Do you spend hours analyzing your CSAT surveys, but your response rates are stuck at 15%? 🤔 Do you feel like you're missing out on the big picture because only dissatisfied customers take the time to respond?
Don't panic! Customer satisfaction measurement is evolving, and generative AI is opening up new opportunities to truly understand how your customers feel, in real time, across 100% of your interactions.
In this comprehensive guide, we explain how to effectively measure customer satisfaction in 2025, why traditional methods are reaching their limits, and how innovations such as Net Emotion Score (NES) are radically transforming the customer experience.
Let's go! 🚀
.png)
Customer satisfaction measures how happy a customer is with a product, service, or interaction with a company. It's one of the most crucial indicators for evaluating the quality of your customer service and predicting customer loyalty.
In plain English?
A satisfied customer is:
Contrary to popular belief, customer satisfaction is not measured solely at the end of a journey. It evolves at every point of contact, with every message exchanged, throughout the entire process of resolving an issue.
Many people confuse customer satisfaction with customer experience. However, these two concepts are complementary but distinct.
Case in point:
Let's imagine a customer who contacts your support team about a delivery issue:
Can you see the difference? Satisfaction focuses on the present moment, while experience encompasses the entire relationship.
Customer expectations have never been higher. Here's why measuring customer satisfaction has become non-negotiable:
📈 86% of customers are willing to pay more for a better customer experience (PWC study)
💰 Acquiring a new customer costs 5 to 7 times more than retaining an existing customer.
🚀 A 5% increase in customer retention can increase profits by 25% to 95%.
⚡ 68% of customers leave a brand because they feel that no one cares about them.
🎯 Customer-centric companies are 60% more profitable than those that are not.
In 2025, customer satisfaction is no longer a "nice to have" but a major competitive advantage. Customers have choices, alternatives are just a click away, and a bad experience is instantly shared on social media.
Measuring customer satisfaction requires a clear methodology and appropriate tools. Here are the essential steps:
Before choosing your indicators, ask yourself these questions:
There are several complementary metrics (we detail them in the next section):
Key moments to measure satisfaction:
Measuring without acting is useless. Turn your data into action:
Spoiler: with solutions like Klark, you can automate this entire analysis and obtain actionable insights in just a few clicks, covering 100% of your interactions rather than just 15%.
What is it?
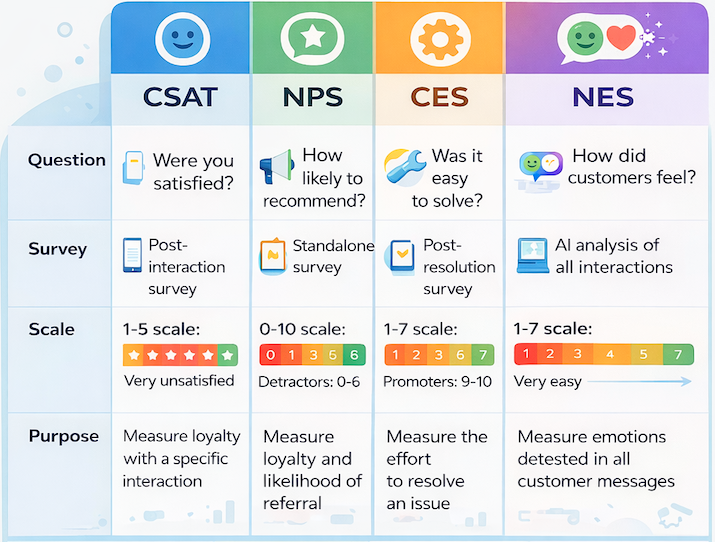
CSAT is the most widely used indicator for measuring customer satisfaction. It is based on a simple question: "Are you satisfied with [service/product/interaction]?" with a response scale of 1 to 5 (or 1 to 10).
Advantages :
Disadvantages:
Calculation :
CSAT = (Number of positive responses / Total number of responses) × 100
What is it?
The NPS measures the likelihood that a customer will recommend your company. Sample question: "On a scale of 0 to 10, how likely are you to recommend [company] to a friend or colleague?"
Categories:
Calculation :
NPS = % Promoters - % Detractors
Usefulness:
NPS is excellent for measuring overall loyalty and anticipating growth, but it does not provide insights into daily interactions with support.
What is it?
The CES measures the effort a customer must make to resolve their problem. Sample question: "On a scale of 1 to 7, how easy was it to resolve your problem?"
Why is this important?
Studies show that 96% of customers who have experienced high levels of difficulty become less loyal, compared to only 9% of those who have not experienced any friction.
Usefulness:
The CES is particularly relevant for customer service: the easier you make life for your customers, the more likely they are to return.
What is it?
NES (Net Emotion Score) is an innovation developed at Klark that revolutionizes customer satisfaction measurement. Unlike CSAT, which relies on surveys, NES automatically analyzes the emotion in each message received using generative AI.
How does it work?
The AI analyzes the tone of each customer message and automatically classifies the emotion into three categories:
Calculation of the NES:
NES = ((Number of positive messages - Number of negative messages) / Total number of messages) × 100
A positive NES means that you are creating overall satisfaction among your customers.
Game-changing benefits:
1. 100% coverage
The NES measures 100% of your received messages, not just 15% of tickets processed like CSAT. The result: you get a comprehensive, unbiased view of actual satisfaction.
2. Real-time measurement throughout the course
With CSAT, you don't know if the customer was happy during the interaction. With NES, you can track the evolution of emotion message by message.
3. Recognition of the work of agents
The NES makes it possible to prove that an agent has done a good job even if the initial problem was complex. If a customer goes from "negative" to "positive" or "neutral," this is a clear indicator that the agent has successfully defused the situation.
4. No charge to the customer
No emails to send, no forms to fill out. The analysis is performed automatically and invisibly to the customer.
5. Proactive detection of irritants
By analyzing 100% of messages, you can quickly identify topics that cause frustration, even if the ticket is ultimately resolved.
At Klark, our clients have seen their coverage rate increase from 15% (traditional CSAT) to 100% (NES), enabling them to make decisions based on comprehensive data rather than a biased sample.
What does that look like in practice?
Every week, Klark's client teams automatically receive a detailed report summarizing NES developments and highlighting areas of concern.
Here is an example of a Klark Weekly Report:

This weekly report allows you to:
No complex manipulation, no dashboard to configure: insights arrive directly in your inbox, ready to be shared with your teams.
At Klark, our clients have seen their coverage rate increase from 15% (traditional CSAT) to 100% (NES), enabling them to make decisions based on comprehensive data rather than a biased sample.
Why?
An unsatisfied customer is a customer who leaves. By quickly identifying signs of dissatisfaction, you can intervene before it's too late.
With the NES at Klark:
Thanks to automatic detection of negative emotions, you are alerted in real time when a customer becomes frustrated. You can take immediate action before the situation escalates.
Result: Reduced churn, loyal customers, improved LTV (Lifetime Value).
Why?
Measuring satisfaction at several stages of the journey allows you to detect where customers drop out or become frustrated.
In concrete terms:
If you notice that messages consistently become negative after a specific action (e.g., redirection to another service), this is a clear sign of a friction point that needs to be addressed.
Result: Optimized journey, fewer escalated tickets, better overall experience.
Why?
Measuring customer satisfaction allows you to differentiate between agents who excel and those who need training.
With the NES:
You can see at a glance which agents are successful in turning negative customers into neutral or positive ones. You can identify best practices and share them with the entire team.
Result: +50% productivity, valued agents, consistent service quality.
Why?
A sudden drop in satisfaction can signal a product issue, outage, or bug before tickets start flooding in.
Example:
If your NES drops sharply in a single day, you know immediately that there is a systemic problem. You can communicate proactively, reassure your customers, and mobilize technical teams.
Result: Crises managed upstream, transparent communication, trust preserved.
Why?
Have you deployed a new chatbot? Trained your agents in empathy? Improved your processes? Satisfaction measurement allows you to quantify the real impact of these actions.
In concrete terms:
Compare the NES or CSAT before and after rolling out an initiative. If satisfaction goes up, you know your investment is paying off.
Result: Data-driven decisions, optimized budgets, clear justification of ROI.
Why?
Insights gained from customer satisfaction surveys are not just relevant to customer support. They are also relevant to product development, marketing, and sales.
Example:
If customers regularly express frustration with a specific feature, the product team can prioritize improving it. If a sales pitch creates unrealistic expectations, marketing can adjust its message.
Result: Aligned organization, shared customer vision, continuous improvement.
Why?
In a saturated market, customer experience becomes the main differentiating factor. Customers compare, evaluate, and share their experiences publicly.
In concrete terms:
High customer satisfaction measured transparently becomes a powerful selling point: testimonials, case studies, public scores.
Result: Strong brand, positive word of mouth, easier acquisition.
Why?
A satisfied customer contacts support less often, generates fewer escalated tickets, and requires less commercial compensation (commercial gestures, refunds).
With solutions such as Klark:
By identifying recurring irritants and correcting them at the source, you automatically reduce the volume of tickets and associated costs. Our customers see a 30% drop in repetitive requests after acting on NES insights.
Result: Controlled costs, operational efficiency, improved profitability.
Sent immediately after a specific interaction: purchase, ticket resolved, phone call.
Advantages: Freshness of the return, precise context
Disadvantages: Can become intrusive if too frequent
Sent at regular intervals (quarterly, annually) to assess overall satisfaction.
Advantages: Long-term vision, identified trends
Disadvantages: Less immediately actionable, memory bias
Integrated directly into your application or website as a pop-up or widget.
Advantages: Immediate context, high response rate
Disadvantages: May interfere with the experience if poorly calibrated
The AI automatically analyzes each message received to extract the emotion, without asking the customer.
Advantages: 100% coverage, zero customer costs, comprehensive data
Disadvantages: High proportion of "neutral" messages because many messages are factual.
That's exactly what Klark does with the Net Emotion Score: a passive, continuous, and comprehensive measure of satisfaction across all your interactions.
Client: Fashion e-commerce site, 5,000 orders/month
Problem: Post-delivery CSAT surveys have a response rate of 12%, making it impossible to get a clear picture.
Solution: Deployment of NES to analyze 100% of messages received after delivery.
Result: Detection within 48 hours of a quality issue with a batch of clothing (customers dissatisfied with the actual size vs. the advertised size). Immediate corrective action, avoiding a PR crisis on social media.
Client: HR SaaS publisher, support team of 15 agents
Problem: Difficulty in objectively evaluating employee performance, feeling of lack of recognition.
Solution: Use NES to measure emotional changes in conversations handled by each agent.
Result: Identification of agents who successfully turn negative customers into positive ones. Implementation of best practice sharing sessions. +40% overall satisfaction in 3 months, valued and motivated agents.
Client: Online bank, 50,000 customers, 200+ tickets/day
Problem: Too many escalations to managers, customers frustrated by back-and-forth communication.
Solution: Analyze conversations with NES to identify the topics that generate the most frustration.
Result: Detection of three major irritants (transfer delays, credit card dispute procedures, blocked account access). Processes reviewed, documentation enhanced, targeted training. 35% reduction in escalations in two months.
Client: General marketplace, 24/7 customer support
Issue: Too many tickets reopened by customers dissatisfied with the initial response.
Solution: NES monitoring on the first response messages from agents.
Result: Identification of agents who generate the most reopenings (inappropriate tone, incomplete responses). Personalized training on empathy and completeness of responses. First contact resolution rate increased from 68% to 82%.
Client: Fast-growing SaaS collaboration startup
Problem: Product team disconnected from customer feedback, prioritizes features with low demand.
Solution: Weekly sharing of NES insights with the product team (topics causing the most frustration).
Result: Roadmap reprioritized based on actual customer pain points. Customer satisfaction up 25% in 6 months, churn halved, improved support/product collaboration.
False. If your surveys are poorly calibrated (too frequent, too long, poorly timed), yes, they can be annoying. But a short, relevant survey sent at the right time adds value.
Better yet: with automatic analysis solutions such as NES, you no longer need to send out surveys at all. AI does the work for you, silently, on 100% of messages.
Partially true. With a response rate of 10-15%, you do indeed have a limited and biased sample (with dissatisfied respondents overrepresented).
The solution: adopt a mixed approach. Keep your CSAT surveys for critical moments, but supplement them with continuous analysis such as NES to gain a comprehensive and unbiased view.
False. Measuring already allows you to prioritize your actions. Even with limited resources, you can focus your efforts on the three irritants that cause the most frustration rather than spreading your energy too thin.
In concrete terms: a simple adjustment to the wording in your standard responses can significantly improve customer perception, without requiring a costly product redesign.
False. Current generative AI models (GPT-4, Claude, etc.) are capable of analyzing nuances, sarcasm, and context. They are not infallible, but their accuracy rate often exceeds 90% when analyzing tone.
At Klark: our customers have noticed that NES detects subtle signals that human agents sometimes miss (such as a customer who remains polite but whose vocabulary betrays growing frustration).
False. Above all, your customers want to be understood and receive quick responses. Automatic satisfaction analysis does not collect any additional personal data; it simply analyzes the tone of messages that have already been exchanged.
Bonus: unlike surveys, which require effort on the part of the customer, automatic analysis is completely transparent and invisible to them.
True! NES measures satisfaction with interactions with customer support, not the intrinsic quality of your product. But a high NES score means that even when there is a problem, your teams know how to handle it with empathy and efficiency, which counts for a lot in terms of loyalty.
And for good reason: a customer can forgive a bug if the support team is responsive and personable. On the other hand, a perfect product with mediocre support will create frustration.
Choosing the right metric depends on your goals, maturity, and resources. Here are the essential criteria:
1. Define your main objective
2. Assess your resource constraints
3. Analyze your data maturity
4. Consider the volume of interactions
1,000 tickets/month → NES essential for comprehensive coverage
5. Think about the customer experience
6. Integrate the multichannel dimension
7. Align with your business KPIs
8. Anticipate change
Spoiler: At Klark, our clients often combine CSAT (for key moments) and NES (for a comprehensive view). CSAT validates overall feelings, while NES allows for granular action on a daily basis.
Customer satisfaction measurement is evolving rapidly thanks to generative AI and new consumer expectations. Here are the trends that will transform the industry in the coming years:
Today: Companies send post-interaction surveys with 10-20% response rates.
Tomorrow: AI will automatically analyze 100% of interactions in real time, detecting not only explicit emotions but also subtle signals (hesitations, rephrasing, changes in tone).
Impact: Support teams will be alerted instantly when a customer becomes frustrated, enabling proactive intervention before the situation escalates.
Today: Satisfaction is measured retrospectively.
Tomorrow: AI will predict a customer's future satisfaction based on their history, profile, and recent behavior. It will automatically adjust the customer journey to maximize satisfaction.
Impact: A customer identified as "at risk of frustration" will automatically receive a senior agent or priority treatment.
Today: Satisfaction is measured channel by channel (email, chat, phone).
Tomorrow: A unified platform will aggregate all signals (voice tone, text analysis, web behavior, product usage) to create a real-time "customer health score."
Impact: Holistic view of satisfaction, ultra-early detection of churn, targeted corrective actions.
Today: Satisfaction insights require human analysis and managerial decisions.
Tomorrow: AI will automatically identify patterns of dissatisfaction, suggest corrective actions, and measure the impact of changes in a closed loop.
Impact: Automated continuous improvement, drastic reduction in time-to-action, proven ROI in real time.
Today: Satisfaction scores are internal and rarely shared publicly.
Tomorrow: Companies will display their satisfaction scores in real time on their websites and social media, similar to Trustpilot or Google ratings.
Impact: Increased pressure to maintain high standards, enhanced customer confidence, competitive differentiation.
At Klark, we are already building this vision with the Net Emotion Score. Our customers already measure 100% of their interactions in real time, detect weak signals, and act proactively to create satisfaction on a large scale.
At Klark, we don't just help you measure customer satisfaction: we give you the tools you need to take concrete action to improve it on a daily basis.
1. The Net Emotion Score (NES): a game-changing innovation
Measure satisfaction on 100% of your received messages, not just 15% of processed tickets. Detect customers who are becoming frustrated in real time and take action before it's too late.
2. Ultra-fast deployment, zero configuration
In just a few hours, Klark analyzes your conversations and provides you with actionable insights. No complex IT projects, no endless configuration. Plug-and-play.
3. Recognizing the work of your agents
The NES allows you to accurately measure the performance of each agent: who is successful at turning negative customers into positive ones? Who is best at handling complex situations? The result: valued agents, targeted training, and increased motivation.
4. Comprehensive and unbiased view
No more bias from dissatisfied customers who respond more than satisfied ones. With Klark, you get a comprehensive, representative, and reliable view of your customers' true satisfaction.
5. Proactive detection of irritants
Identify in just a few clicks the issues that cause the most frustration, the processes that get stuck, and the wording that annoys people. Prioritize your improvement actions on what really matters.
6. No charge for your customers
No survey emails to send, no forms to fill out. The analysis is automatic and invisible to the customer, who doesn't have to do anything else.
7. Fast and measurable ROI
Our customers report on average:
8. Native integrations with your existing tools
Zendesk, Salesforce, Freshdesk, Gorgias, Front, Intercom... Klark connects to your helpdesk in just a few clicks. Your agents can keep doing what they're used to, with no need to change tools.
More than 50 brands and 2,000 agents already use Klark to measure and improve customer satisfaction on a daily basis. Why not give it a try?
Measuring customer satisfaction in 2025 no longer means sending a CSAT survey to 15% of your customers and hoping to gain actionable insights. It means adopting a modern, comprehensive, and proactive approach that covers 100% of your interactions.
Here's what you need to remember:
The time to act is now. Customer expectations have never been higher, and competition has never been fiercer. Companies that are able to accurately measure and quickly respond to customer satisfaction will be the ones that win the battle for loyalty.
So, are you ready to go from 15% to 100% satisfaction coverage? 🚀
👉 If you would like to receive your NES Weekly Report, click here!
About Klark
Klark is a generative AI platform that helps customer service agents respond faster, more accurately, without changing their tools or habits. Deployable in minutes, Klark is already used by over 50 brands and 2,000 agents.